
Loading...
Every bet you place has an expected value — a mathematical projection of its long-term profitability. Most bets have a negative expected value, because the bookmaker’s margin ensures that the odds on offer are slightly lower than the true probability warrants. A value bet flips that equation: you back a horse at a price that exceeds its true chance of winning, giving you a positive expected value over time. Price versus probability is the fundamental calculation, and it is the only reliable path to long-term profit in horse racing.
Value betting is not about picking winners. A punter who backs horses at inflated odds will lose more bets than they win. The profit comes from the maths: when the price compensates for the losing bets, the net return is positive. Understanding this distinction — that strike rate is secondary to value — is the first step towards a genuinely analytical approach to racing.
Expected Value — The Maths Behind Every Bet
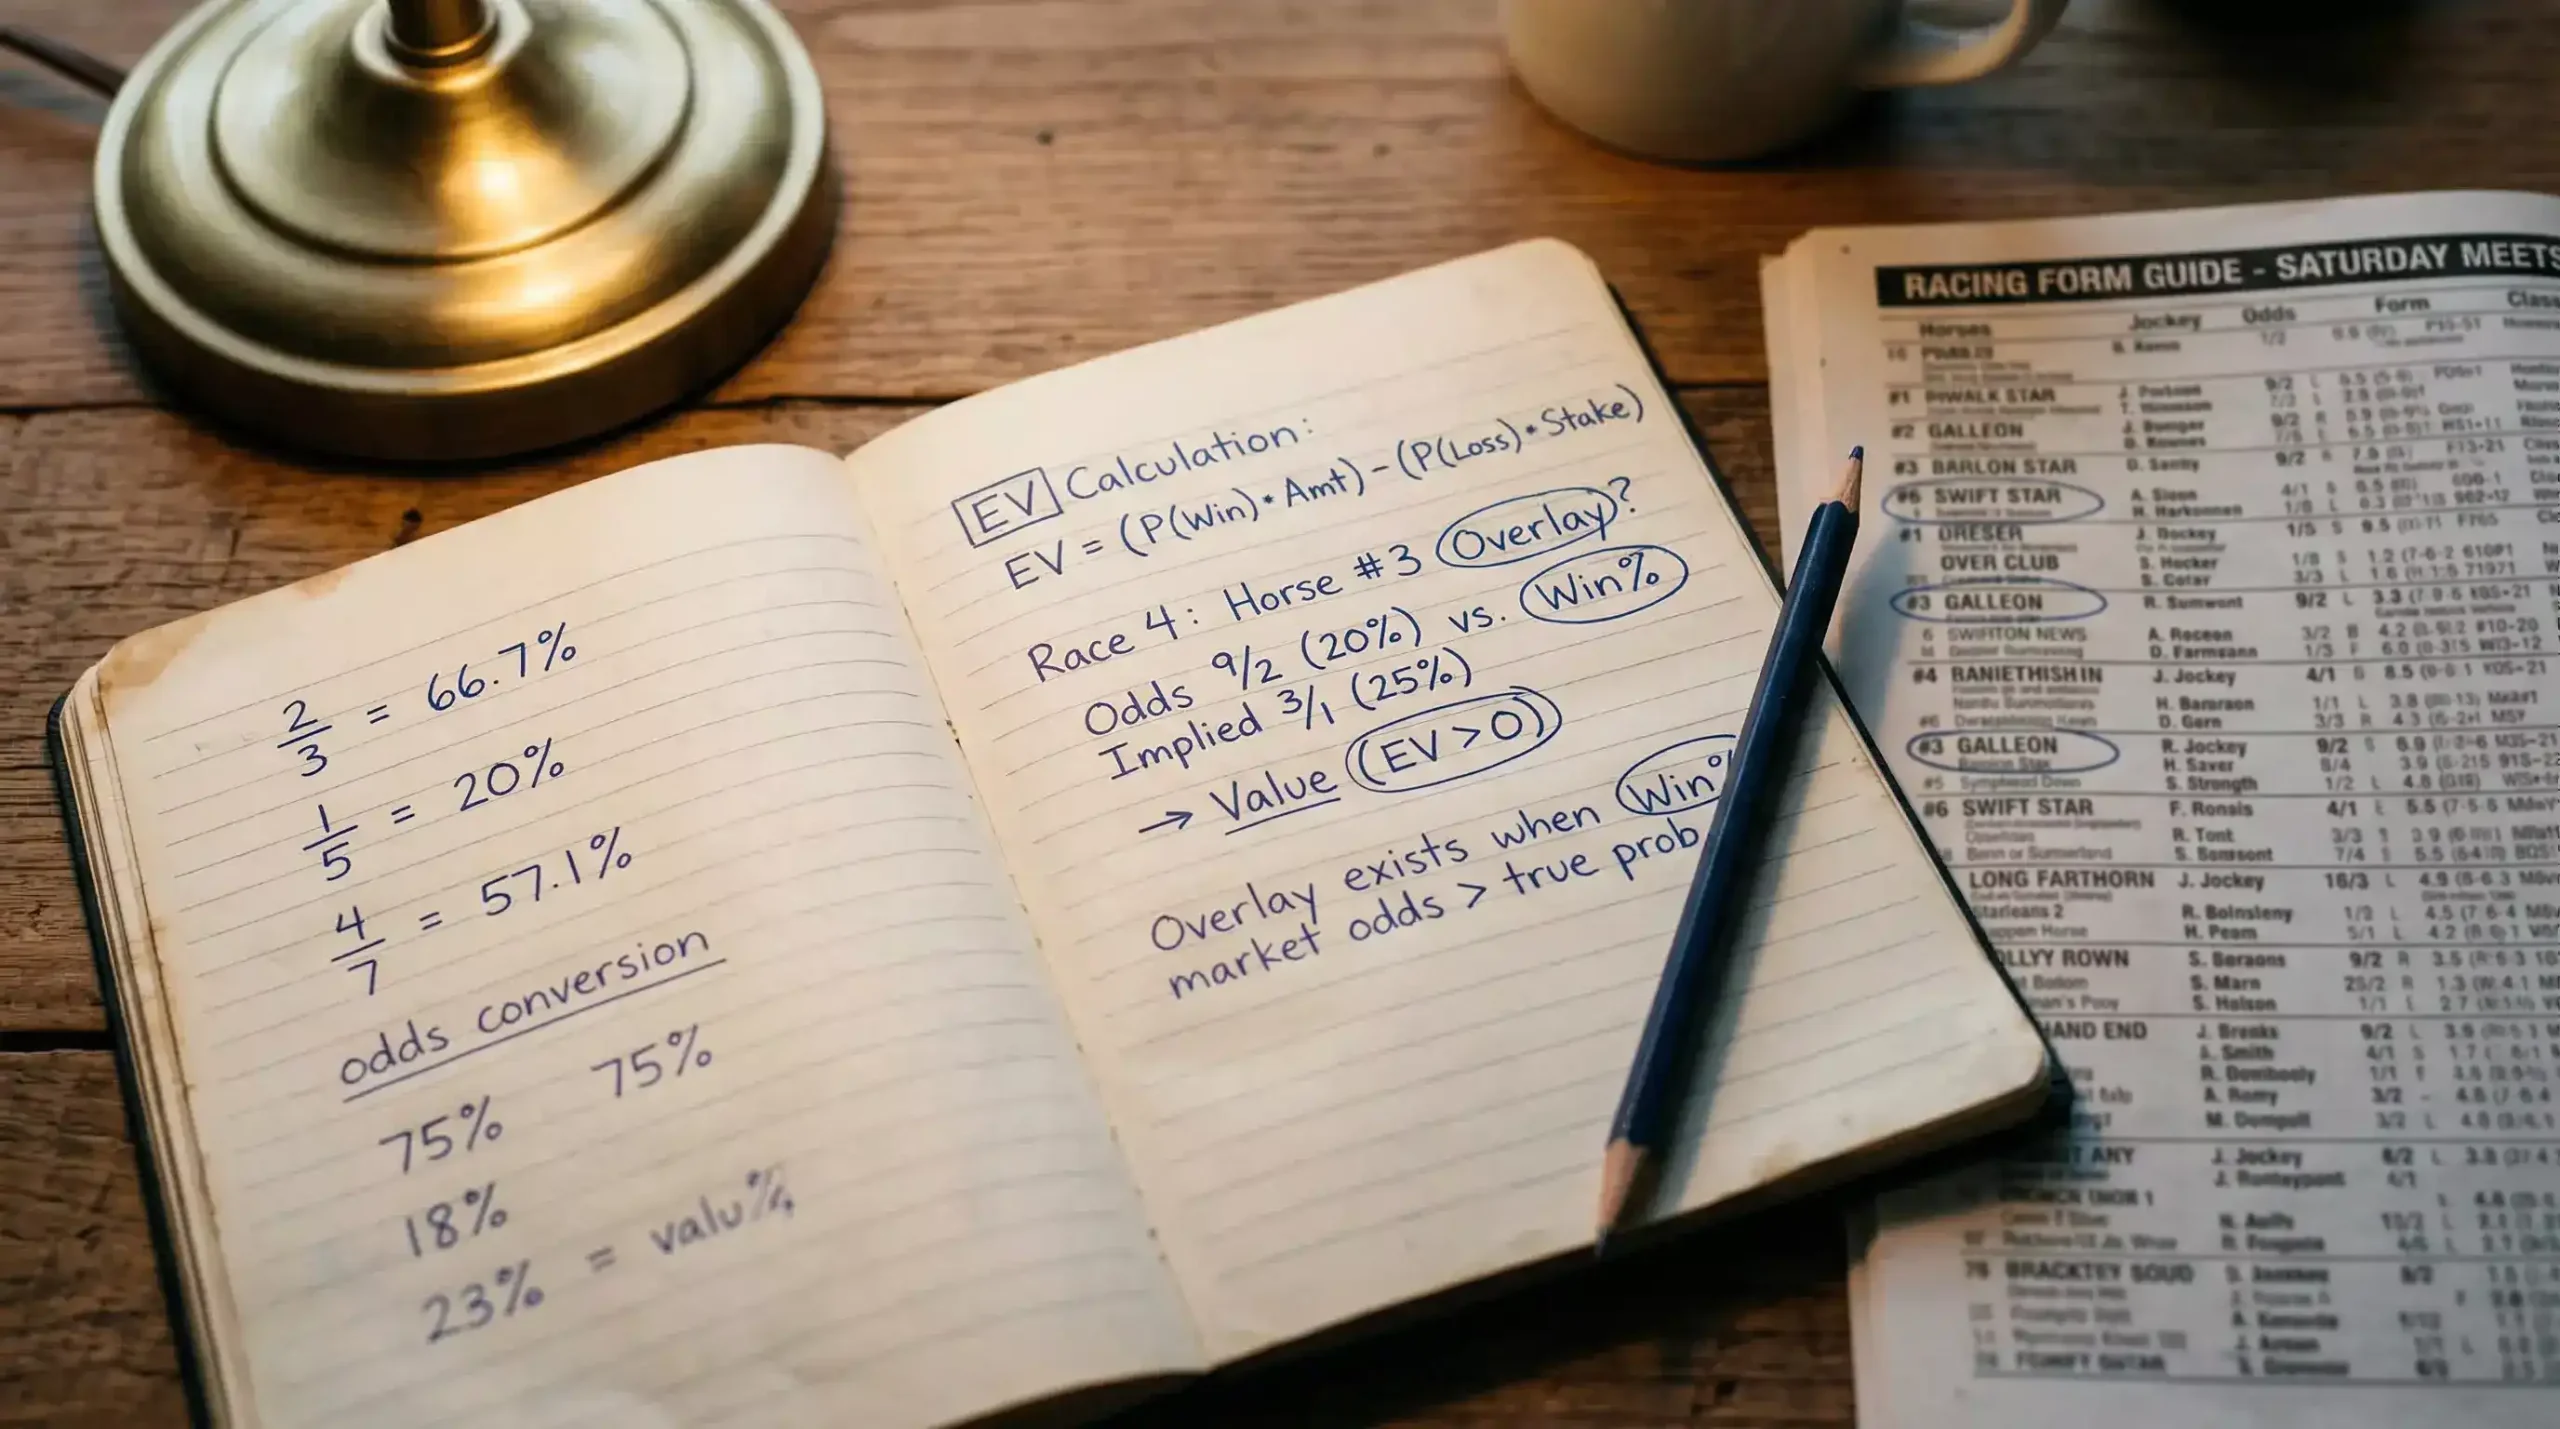
Expected value (EV) is the average amount you would win or lose per bet if you placed the same bet an infinite number of times. The formula is simple: EV = (probability of winning × profit if win) − (probability of losing × stake). A positive EV means the bet is profitable in the long run. A negative EV means it is not.
Here is a concrete example. You assess a horse as having a 20% chance of winning. The bookmaker offers 6/1 (7.00 decimal). If you stake £10: EV = (0.20 × £60) − (0.80 × £10) = £12 − £8 = +£4. The expected value is +£4 per bet. Over 100 identical bets, you would expect to win 20 times (collecting £60 profit each time = £1,200) and lose 80 times (losing £10 each time = £800). Net profit: £400. That is value.
Now change the odds to 3/1 (4.00 decimal) with the same 20% probability. EV = (0.20 × £30) − (0.80 × £10) = £6 − £8 = −£2. Negative expected value. Over 100 bets at these odds, you lose money even though the horse wins one in five. The probability has not changed; only the price has. And the price is all that matters.
This concept applies across the entire UK racing market. With total betting turnover falling 4.3% in 2025, according to the BHA’s Racing Report, margins are tightening and the gap between profitable and unprofitable punters is narrowing. In a smaller market, the ability to consistently identify positive-EV bets is the edge that separates the sustainable bettor from the one who bleeds money slowly enough not to notice.
How to Identify Overlays in Horse Racing Markets
An overlay exists when the bookmaker’s odds imply a lower probability than the horse’s true chance. Finding overlays requires two things: your own probability estimate and a comparison with the market.
Building your own probability estimate does not require a degree in statistics. Start with form analysis: recent performance, going preference, distance suitability, class level and connections. Assign a rough percentage chance to each runner in the race. Your figures will not be precise — no one’s are — but they create a framework for comparison. If your analysis gives a horse a 25% chance and the bookmaker’s odds imply 12%, the overlay is significant and worth investigating further.
Market structure tells you where to look. BHA data shows that turnover on Premier racing rose 1.1% while Core fixture turnover dropped 8.1%. Premier markets — the big Saturday cards, the festival races — attract more money, more bookmaker attention and tighter margins. The odds are more efficiently priced because thousands of informed punters and professional traders hammer the market into shape. Core markets, by contrast, receive less scrutiny. A mid-afternoon handicap at Catterick or Plumpton is priced by a smaller team, with less data and less competitive pressure. Overlays are more frequent in these quieter corners of the calendar.
Odds comparison is the final practical step. A horse might be 7/1 with one bookmaker and 10/1 with another. If your analysis says 8/1 is fair value, the 10/1 price is an overlay regardless of what other operators are offering. Using an odds comparison service — Oddschecker or similar — is not optional for value betting. It is the tool that turns your probability estimate into a betting decision by showing you which bookmaker, if any, is offering a price that exceeds your assessment.
A Practical Framework for Value Selection
A practical value betting framework for horse racing can be summarised in five steps, each of which feeds into the next.
Step one: filter. Not every race is worth analysing. Focus on races where you have an informational edge — a track you know well, a trainer you follow closely, a going description that matches a horse’s proven profile. Passing on races where you have no edge is as important as betting on those where you do.
Step two: assess. For each runner, assign a rough probability based on your form analysis. This does not need to be mathematically exact — a range is fine. “I think this horse has a 15-20% chance” translates to a fair price of between 4/1 and 11/2. If the market is offering 8/1, you are in overlay territory.
Step three: compare. Check the best available odds across bookmakers and exchanges. If the highest price exceeds your fair-value estimate, you have a potential value bet. If the best price falls short of your estimate, the market disagrees with your assessment, and you should either revise your analysis or pass.
Step four: stake. Apply your staking plan — level stakes, percentage stakes or variable stakes based on the size of the perceived overlay. A horse where the overlay is marginal warrants a smaller stake than one where the overlay is substantial. Never let excitement dictate the stake.
Step five: record. Log the bet — selection, odds taken, your probability estimate, stake, result and profit or loss. Over time, this dataset becomes the evidence base that tells you whether your probability estimates are accurate and whether your value-betting approach is genuinely profitable or merely feels like it is.
Staying Disciplined — Why Most Punters Fail at Value
Most punters who attempt value betting abandon it within months — not because the method is flawed, but because the experience of losing frequently is psychologically punishing. A value bettor backing selections at an average of 6/1 will lose roughly five out of every six bets. That is a lot of losing, and it does not feel like progress even when the maths says it is.
The discipline gap is the single biggest reason value betting fails in practice. Punters revert to backing short-priced favourites because winning feels better, even when the returns are negative-EV over time. They abandon a losing run at precisely the point when regression to the mean would have turned their results around. They overtrade in frustration, placing bets on races they have not analysed, because the urge to win something overrides the discipline to wait for value.
Tracking results is the antidote. A spreadsheet that shows your cumulative profit or loss over 200, 500 or 1,000 bets provides the evidence that gut feeling cannot. If your value estimates are accurate, the profit curve will trend upwards despite extended losing runs. If it does not, the data tells you to recalibrate your estimates rather than to bet more aggressively.
As BHA Director of Racing Richard Wayman has noted in the context of the sport’s shifting financial dynamics, the betting landscape is being reshaped by affordability checks and regulatory change. Speaking in the BHA’s annual review, Wayman stated he had “no doubt” that falling turnover was driven primarily by affordability checks, causing customers to either stop betting or migrate to unlicensed operators. The price versus probability discipline that underpins value betting is not just an academic exercise — it is a survival skill in a market where margins are thinning, regulation is tightening, and the careless punter’s window of sustainability is narrowing with every passing year.